Building an AI Visibility Dashboard with Semrush
Let’s dive into the digital renaissance that is AI visibility, shall we? As a writer perpetually on the hunt for ways to optimize my content, I know just how crucial it is to forge effective connections between artificial intelligence and genuine user intent. The great irony? Often, the pages that AI highlights aren’t the ones that are raking in Google clicks. But fear not! In this post, I’m here to walk you through building an AI visibility dashboard with Semrush that extracts tangible insights from the ocean of data swirling around us.
Why an AI Visibility Dashboard?
Picture this: you’ve poured countless hours into crafting your content, meticulously choosing every word—only to find out that robots are giving the spotlight to pages that have hardly seen a single click. It’s enough to send any creator into a full-blown existential crisis. 😱 This is where an AI visibility dashboard comes into play. I mean, who wouldn’t want an easy, digestible way to see if AI recommendations align with user behavior? If it’s visibility you’re after, consider a dashboard your new best friend.
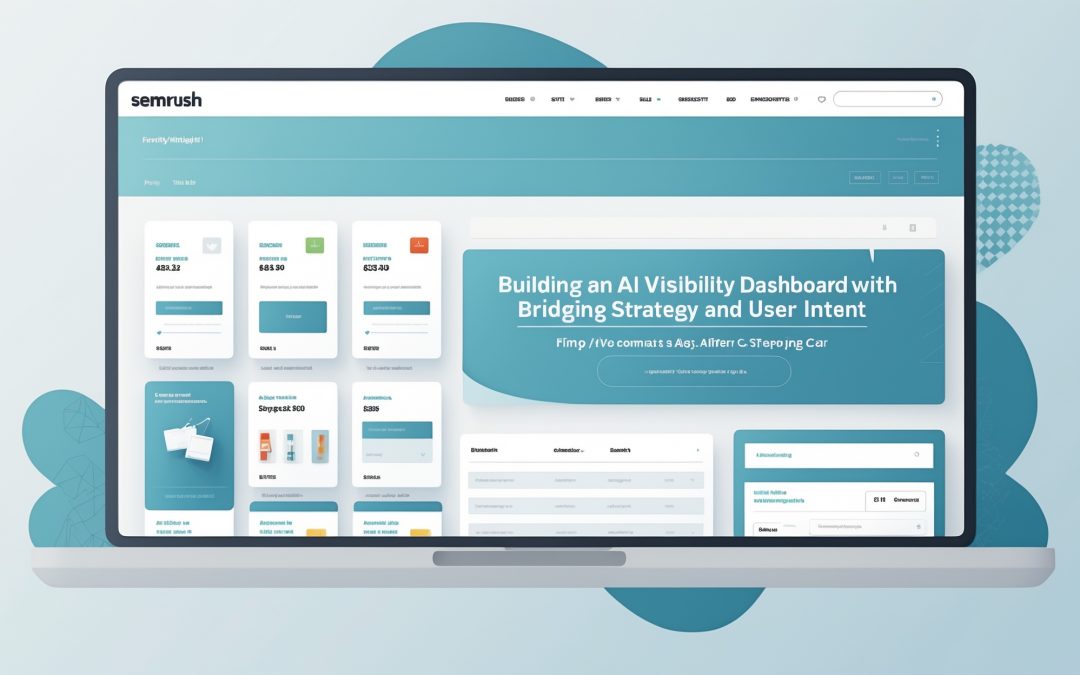
The dashboard allows you to visualize how AI cites your pages in relation to actual traffic. Instead of being left in the dark, you’ll have a smartly designed interface illuminating insights that can steer your future content strategies—and ultimately, your online presence. It’s like having a map to navigate through the shifting sands of the digital landscape.
Step-by-Step: Creating Your Dashboard
Now let’s get our hands dirty. You don’t need to be a data scientist; I promise you can do this with just a sprinkle of patience and a dash of curiosity.
1. Gather Your Data
First thing’s first: you need to gather data on your website’s performance. 💻 Open up Semrush and make a beeline for the *Domain Overview* section. This nifty little part of the tool allows you to capture broad visibility metrics such as organic keywords, traffic trends, and competitors’ performance. Remember, the devil is in the details here—this data forms the backbone of your dashboard.
2. Identify Key Metrics
Next, let’s cut to the chase and identify what specifically you want your dashboard to show. Is it organic traffic, keyword rankings, or maybe even the page performance against AI citations? I find that keeping it simple is usually the best strategy—focus on the metrics that tie directly back to the content you’ve crafted.
For example, metrics to consider include:
- Organic Traffic
- Keyword Rankings
- Backlinks
- Page Titles Used by AI
- CTR (Click-Through Rate)
These insights will help you analyze the content’s resonance with real human users versus the cold and calculating algorithms of AI. It’s essential to keep an eye on how well your data stacks up against these important capabilities!
3. Design Your Dashboard
Once you have your metrics lined up, it’s time to actually design your dashboard. Semrush allows you to customize templates, which is like a blank canvas just waiting for your artistic flair. 🎨 Arrange the statistics in a way that makes sense to you—perhaps a beautiful graph illustrating organic traffic in correlation to AI citations? Who doesn’t love good visuals to tell a compelling story?
Incorporate various charts, tables, or line graphs. Each visual element should help communicate the vital relationships between AI mentions, click data, and traffic behaviors. By organizing your data in a visually appealing way, you’ll be able to spot trends at a glance. Trust me; this makes it notably easier when you want to strategize or report your findings.
4. Analyze and Adapt
Alright, you’ve built your stunning AI visibility dashboard; now what? It’s time to dive into the analytics. Take a compassionate hacking approach to your findings—this isn’t just about patting yourself on the back for the numbers. Analyze the gaps between what the AI cites and what actually brings in traffic.
Ask yourself questions like: Are there particular keywords that are gaining traction? Are these keywords aligned with what AI thinks is relevant? This stage is the beating heart of the dashboard—an ongoing evaluation where you both celebrate successes and spot glaring anomalies worthy of adjustment.
Wrapping It Up
Crafting an AI visibility dashboard using Semrush isn’t just a task on your to-do list; it’s a revolution in how you engage with your content. Imagine sifting through complex layers of data to distill it into actionable insights—a vivid picture of your content’s actual performance versus AI perception. By leveraging the right metrics and clever design, you’re not just aiming for visibility; you’re positioning yourself as a thought leader in this tangled web of digital nonsense. 🚀
So go ahead, build your dashboard, and let the numbers do the talking. Because at the end of the day, understanding AI’s perceptions versus our realities can redefine the future of our content creation! 🕶️